Floor & Decor: Specializing To Beat Home Depot And Lowe’s (FND)
AleksandarNakic/E+ via Getty Images
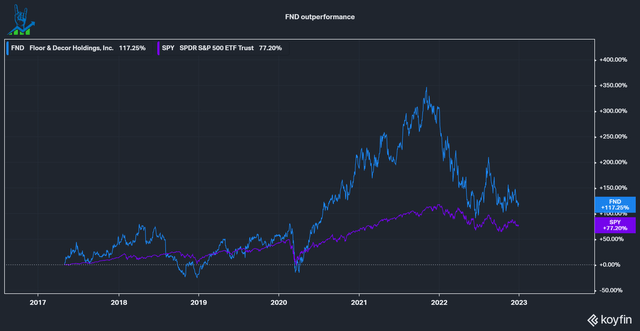
Floor & Decor Holdings (NYSE:FND) is one of those plain businesses that outperformed the SPY over the last few years (Floor & Decor IPO’ed in 2017) without grabbing too much attention. Even though it’s a pretty simple business, it has a moat out of the sight of normal customers and presents a sound investment case.
Throughout this article, I’ll mainly refer to the company as its ticker FND.
Floor & Decor outperformance (Koyfin)
Competitive advantage in a growing Industry
FND is a specialty retailer focused on the $41 billion Hard-surface flooring market (Slide 27), with some adjacent categories i.e. accessories like faucets ($8-13 billion market). For decades there has been a battle between hard surfaces, soft surfaces (mostly carpets) and other resilient in the flooring industry. Carpet used to be the cheapest option decades ago, but due to low-cost manufacturing, hard surface solutions have kept gaining market share. In 2021 hard surfaces accounted for 57{6b977529af4b490fe19a3f85472c6203ccfa467a56646e317a890c6580e8b827}, up from 44{6b977529af4b490fe19a3f85472c6203ccfa467a56646e317a890c6580e8b827} in 2012 (Slide 28).
Market Research Future estimates that the North American Hard surface flooring market will grow at a 5.12{6b977529af4b490fe19a3f85472c6203ccfa467a56646e317a890c6580e8b827} CAGR through 2030 to $51.45 billion, leaving room to grow in addition to market share gains.
The market is roughly separated into three categories:
- Large retailers (predominantly Home Depot (HD) and Lowe’s (LOW), lowest amount of customer service )
- Specialty retailers (FND belongs in this category, high specialty knowledge service and highest number of SKUs)
- Mom and pops shops (highest amount of direct service and engagement to the customer, but limited through small scale)
I believe FND has several competitive advantages that will aid them to keep expanding and growing toward its long-term goal of 500 stores (Slide 31).
Low price advantage through direct sourcing
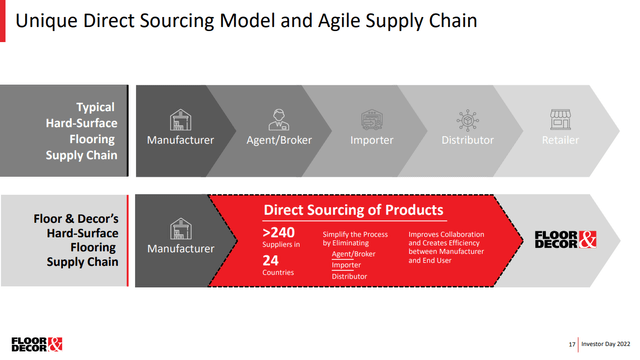
The value proposition for FND’s customers is to have the best selection coupled with the lowest prices. FND manages to achieve this through its direct sourcing strategy, which cuts out all middlemen and directly sources the supply from >240 suppliers in 24 countries. By doing this, the company realizes cheaper sourcing costs, which they give to the customers, similar to Costco’s (COST) strategy.
FND sourcing strategy (FND investor presentation)
Warehouse store concepts
FND runs a warehouse store concept: Large warehouses as stores, where most of the area is accessible to customers. No significant overhead where no sales are happening. There are countless rows with examples of tiles with inventory behind, clearly visible to the customer to ensure they can walk out of the store with their supplies instead of having to order and wait. Each warehouse also features a reception desk designated for Pros, which leads me to my next point:
Customer focus and professionals
FND has a focus on long-term relationships with professionals (Pros influence 40{6b977529af4b490fe19a3f85472c6203ccfa467a56646e317a890c6580e8b827} of sales according to management through direct purchases or telling customers to buy at FND) and offers them several advantages over its competitors:
- The aforementioned PRO desks for fast help and assistance
- PRO loyalty program, which has 59{6b977529af4b490fe19a3f85472c6203ccfa467a56646e317a890c6580e8b827} of active PROs enrolled and each enrolled PRO spends 3x more (Slide 40)
- Commercial Credit options
- PRO Premier App
- PRO Education events
- Free storage and return options, where Pros can store inventory at an FND warehouse for a short time without extra charge
The company can accelerate its growth through this large network of loyal PROs. After all a professional transacts frequently, versus a normal homeowner, who remodels or renovates their home every couple of years.
Compensation structure
I believe that management and compensation structures are not looked at enough by investors. All of the data presented in the following section is from the most recent Proxy statement.
The company has an average board tenure of 6.2 years, which is pretty good for a company of its age. The CEO, President, CFO and many other executives have been with the company for at least eight years.
The directors and executive officers hold 2.7{6b977529af4b490fe19a3f85472c6203ccfa467a56646e317a890c6580e8b827} ownership (CEO 0.77{6b977529af4b490fe19a3f85472c6203ccfa467a56646e317a890c6580e8b827}) in the company, a number I’d like to see higher. Still, it does represent some skin in the game and is a total of $200 million for all and $56 million for the CEO.
Incentives are very important to align management with shareholders. Let’s look at the short-term and long-term incentives:
- Short-term: 20{6b977529af4b490fe19a3f85472c6203ccfa467a56646e317a890c6580e8b827} net sales, 80{6b977529af4b490fe19a3f85472c6203ccfa467a56646e317a890c6580e8b827} operating income (adjusted for unusual items) -> forces management to be disciplined with its capital, while growing. I like to see operating income as a high percentage of an incentive structure. Operating income is also much harder to manipulate than metrics like EPS or (adjusted) EBITDA.
- Long-term: Adjusted EBIT targets with three-year vesting periods. Over the period, ROIC must meet 17{6b977529af4b490fe19a3f85472c6203ccfa467a56646e317a890c6580e8b827} for every year, otherwise, the long-term incentive multiplier is 0{6b977529af4b490fe19a3f85472c6203ccfa467a56646e317a890c6580e8b827}. -> again forces management to grow the profits of the company. I love the addition of an ROIC requirement. If management just forces growth at all costs, then ROIC could fall under 17{6b977529af4b490fe19a3f85472c6203ccfa467a56646e317a890c6580e8b827}, making all long-term options voided.
Overall this is an exemplary management incentive structure and I’d love to see similar from most companies out there.
FND is fairly priced
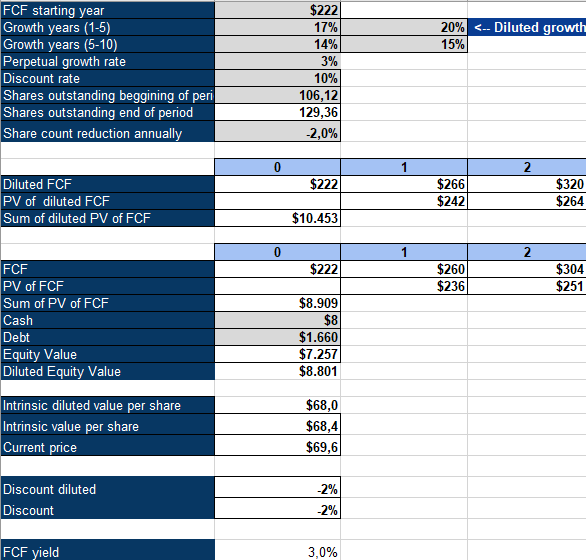
To value FND, I’ll take a look at an inverse DCF analysis. The company has a large whitespace of roughly 300 stores, which would almost triple its store count. The company aims to grow store count by 20{6b977529af4b490fe19a3f85472c6203ccfa467a56646e317a890c6580e8b827} a year together with a 10-year same-store sales (SSS) of 14.5{6b977529af4b490fe19a3f85472c6203ccfa467a56646e317a890c6580e8b827} (Slide 133). Add continued potential to raise margins and I can see a path to prolonged 20-25{6b977529af4b490fe19a3f85472c6203ccfa467a56646e317a890c6580e8b827} FCF growth. In the last 12 months, the company had a significant inventory build-up like many other retailers to combat disrupted supply chains, more than doubling with a $660 million change in inventories at the peak ($487 million right now). This made FCF negative and so we need to normalize it. It is hard to estimate a good value here, because most of the Capex the company invests ($450 million last 12 months) is used for growth and should be counted as investments. For simplicity I will use 80{6b977529af4b490fe19a3f85472c6203ccfa467a56646e317a890c6580e8b827} of net income for the sake of the model, this might be a lowball, considering that 2020 saw a 100{6b977529af4b490fe19a3f85472c6203ccfa467a56646e317a890c6580e8b827} Net income/FCF conversion rate and that operating cashflow is always (excluding TTM) higher than Net income. Using those assumptions with a 10{6b977529af4b490fe19a3f85472c6203ccfa467a56646e317a890c6580e8b827} discount rate, a 3{6b977529af4b490fe19a3f85472c6203ccfa467a56646e317a890c6580e8b827} perpetual growth rate and an expected annual dilution of 2{6b977529af4b490fe19a3f85472c6203ccfa467a56646e317a890c6580e8b827} (this likely will trend lower, but let’s be conservative) leaves us with an expected growth rate of 20{6b977529af4b490fe19a3f85472c6203ccfa467a56646e317a890c6580e8b827} for the next 5 years, followed by 15{6b977529af4b490fe19a3f85472c6203ccfa467a56646e317a890c6580e8b827} for the next 5 years. Considering the runway the company has, the good management and the in my opinion conservative assumptions, I see Floor & Decor as a buy.
FND Inverse DCF (Authors Model)
